By Aaron Goldman, VP, Marketing & Strategic Partnerships
Click to view larger image.
Search query volume has long been used as a barometer of consumer intent. But can it give us a good read on voter intent?
Since search is such a private activity, there’s likely little bias from the so-called Bradley Effect that pervades the polls. So, with just a few hours left before this historic US Presidential race is decided, let’s take a look at Google Insights for Search and see if we can put our finger on the pulse of the nation.
Comparing “Obama” and “McCain” query volume over the past 30 days (see chart below), it looks like Obama is starting to pull away. This corresponds with CNN’s National Poll of Polls, which has Obama currently with his highest percentage lead to date.
Click to view larger image.
If we expand the filter to the past 90 days (see chart below), we see McCain briefly overtake Obama in query volume back in September. Sure enough, from Sept. 8th - 12th, McCain jumped ahead in the polls (per CNN) and battled to a tie for a few days before falling behind again on the 17th. So there seems to be some correlation here.
Click to view larger image.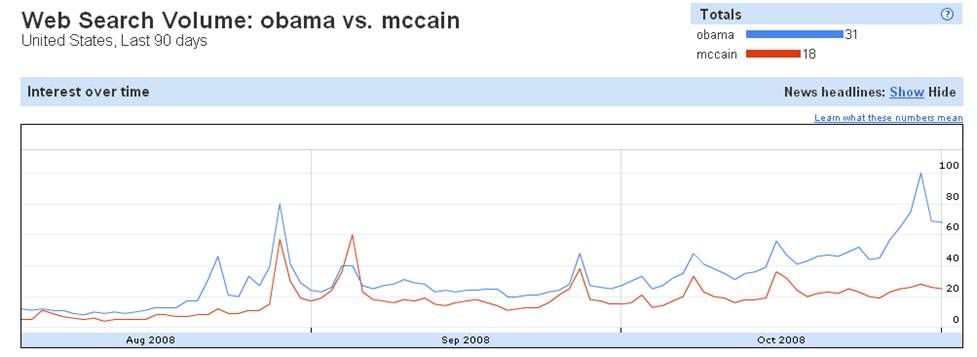
Back to that recent spike for Obama at the end of October, If you look at the breakdown by day (first chart above), you see the jump corresponds to the day after he ran those 30 minute spots across the major networks. Is anyone out there still questioning the impact of TV ads on search? Indeed, Google Insights (see chart below) shows “obama infomercial” as a breakout query, meaning it’s indexing off the charts in terms of increase in search volume.
Click to view larger image.
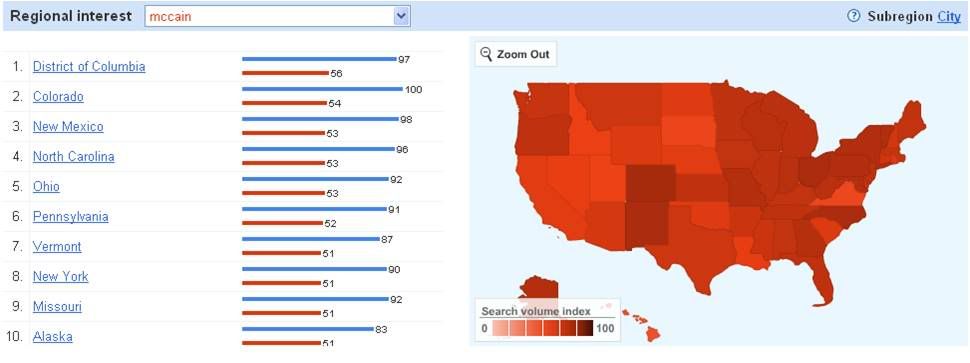
Now let’s zero in on the swing states to see what we can expect here. Since Obama holds the overall query volume lead in most states, perhaps looking at the index of each state relative to the total threshold for each candidate will be a better indicator of which direction that state is headed.
First a glimpse at the states CNN is calling “unsure” (see gray states in graphic below)…
Click to view larger image.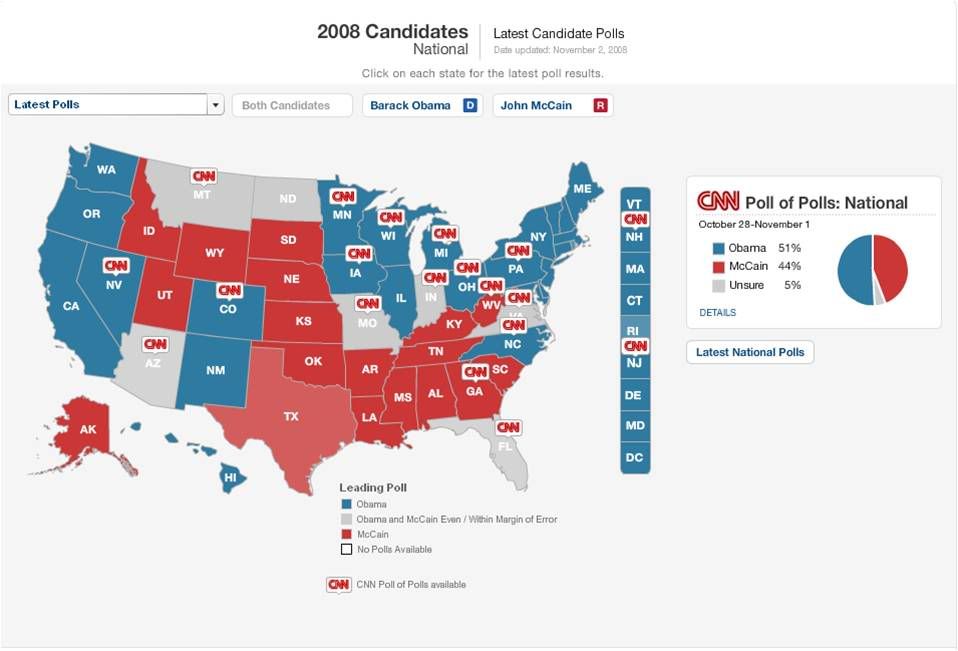
Now the verdict from Google Insights based on the past 90 days query volume (see charts below)…
Montana indexes at 80 for McCain and 77 for Obama (again, that’s relative to each candidate’s highest volume state)
North Dakota: 72-66 for McCain
Missouri: 92 -90 for Obama
Indiana: 88-86 for McCain
Virginia: 64-62 for Obama
Florida : 93-85 for Obama
We also know Ohio and Pennsylvania are battleground states so let’s do a quick check on those…
Ohio: 94-92 for McCain
Pennsylvania: 91 McCain, 91 Obama (dead heat!)
Click to view larger image.
If these state indices hold up and all the other states go as expected, Barack Obama will have enough electoral votes to become our next President. If McCain wins, however, we may as well toss our computers out the window -- which is what some people think the President should do anyway, much to my chagrin -- because search is clearly not as relevant as we all thought.
It will certainly be interesting to see how things play out. Now, for those of you that haven’t yet cast your ballot, stop searching and start voting!
Update 11/5 - 6:30am: Well, it looks like Google got it right and Obama will ride his wave of search volume all the way to the White House.
Now, before we go disregarding Election Polls in favor of Google Insights, let's take heed of Mr. Meunier's comments on this post. Indeed, it may be a stretch to claim that "these broad matched keywords reflect a voter's preference for a candidate" as a good amount of query volume may represent negative buzz. That said, it's hard to argue with the numbers that show the polls, and now the popular vote, aligning with Google search trends.
As for how the state-by-state predictions fared, Google was 3 out of 5 with 2 states still undecided. Again, the admittedly suspect methodology here was to index each state against that candidate's highest volume state. Here's the breakdown...
Montana: 80-77 for Obama (wrong!)
North Dakota: 72-66 for McCain (right!)
Missouri: 92 -90 for Obama (TBD)
Indiana: 88-86 for McCain (TBD)
Virginia: 64-62 for Obama (right!)
Florida : 93-85 for Obama (right!)
Ohio: 94-92 for McCain (wrong!)
Click to view larger image.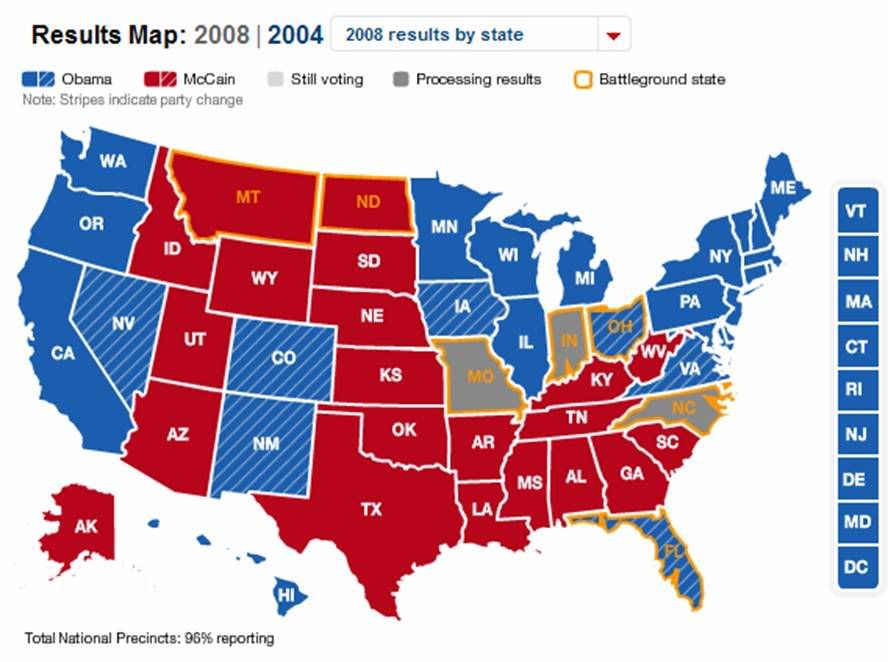
There's no doubt the Internet and search engines played an unprecedented role in this election, from connecting voters with the candidates and other voters to fundraising and organizing efforts to arming voters with information on the issues.
As for the ability of Google to predict the outcome, methinks it's time for the folks at Mattel to update their Magic 8 Ball answers...
Click to view larger image.
skip to main |
skip to sidebar


Welcome to the Resolution Media Blog
We are a digital marketing agency with a foundation in search engine marketing (SEM). We integrate online consumer-driven data to the evolving digital landscapre, driving measurable and actionable insights for our clients to achieve established business objectives and targeted growth.
We offer a variety of services including:
- Pay-Per-Click Search Advertising (PPC)
- Search Engine Optimization (SEO)
- Website Conversion Optimization (WCO)
- Digital Behavior Analysis (DBA)
- Behavioral Targeting (BT)
- Mobile, Video and Social Media
VIEW POSTS by TOPIC or AUTHOR
VIEW POSTS by DATE
Resolution Media Bloggers
Search Engine Watch
Search Engine Land: News About Search Engines & Search Marketing
ClickZ News
MediaPost | Online Media News
iMedia Connection: Search
Additional Marketing Resources

Contact
Resolution Media Headquarters:
314 W Superior
2nd Floor
Chicago, IL 60654
T: (312) 980-1600
F: (312) 980-1699
E: Info@ResolutionMedia.com
New York:
195 Broadway
18th Floor
New York, NY 10007
San Francisco:
555 Market Street
Suite 750
San Francisco, CA 94105
Los Angeles:
5353 Grosvenor Boulevard
Los Angeles, CA 90066
314 W Superior
2nd Floor
Chicago, IL 60654
T: (312) 980-1600
F: (312) 980-1699
E: Info@ResolutionMedia.com
New York:
195 Broadway
18th Floor
New York, NY 10007
San Francisco:
555 Market Street
Suite 750
San Francisco, CA 94105
Los Angeles:
5353 Grosvenor Boulevard
Los Angeles, CA 90066
Copyright © 2008 Resolution Media, Inc. All rights reserved.
1 comments:
Interesting post, but I think you really need to add Palin to your list of keywords to get an accurate read of buzz for the ticket. According to Google's Election Trends site, Sarah Palin regularly leads John McCain in search volume:
http://www.google.com/intl/en/trends/elections/
Fortunately for Democrats, she's consistently second to Barack.
That said, I don't know that these broad matched keywords reflect a voter's preference for a candidate. Half of the top searches for palin for all time are related to SNL's satirical representation of her, and one has to do with the embarrassing interviews she gave. Only 40% of the buzz is either neutral or positive. I wouldn't go so far as to say that the inverse of your post is true-- to say that Google might predict the election by tabulating who has the least buzz, as most of it appears to be negative; but I do think you need to factor in negative buzz, and subtract it from the total. Looking forward to finding out the answer to your question tonight on television (and twitter), regardless.
Post a Comment